Query Performance Testing
Installation and Configuration
Introduction
With the Query Performance Tester, the search performance and expected search hits can be tested automatically and reproducibly. The most important features are:
- Testing with custom search apps
- Creation of test plans (what is searched for, what are the expected results)
- Parameterization of test runs (user, number of parallel searches, number of iterations)
- Monitoring a test run
- Display detailed statistics of a test run
Configuration
Open the tab “Indices” in the menu “Configuration” of the Mindbreeze Management Center. Add a new Service in the “Services” section by clicking on the “Add Service” button. Select the service type “QueryPerformanceTesterService” from the “Service” list.
Base Configuration
Setting | Description |
Service Bind Port | The port on which the service is listening for requests |
Setup
Launching a Test Job
You can find the user interface of the Query Performance Tester Service in the Mindbreeze Management Center in the menu "Reporting", submenu "Query Performance Tests".
If you are using CentOS 6, you can add the URL to “Query Performance Tests” via resources.json. By default, this feature is only visible in CentOS7. The URL looks like this:
:8443/index/<YOUR SERVICE BIND PORT>/admin/index.html
You can find the Service Bind Port in ‘Services’ – Settings in the Configuration.
Here you can find the documentation how to add a menu entry: Managementcenter Menu
Adding a Search App
In the “Search Apps” section click on “Add Search App”.
Set the name of the search app. If JavaScript code is available for the given app, which transforms the request before sending it, paste it in the text field or upload it from a file using the “Upload Search App” button. For a simple use case the field can be left empty.
Uploading a Test Plan
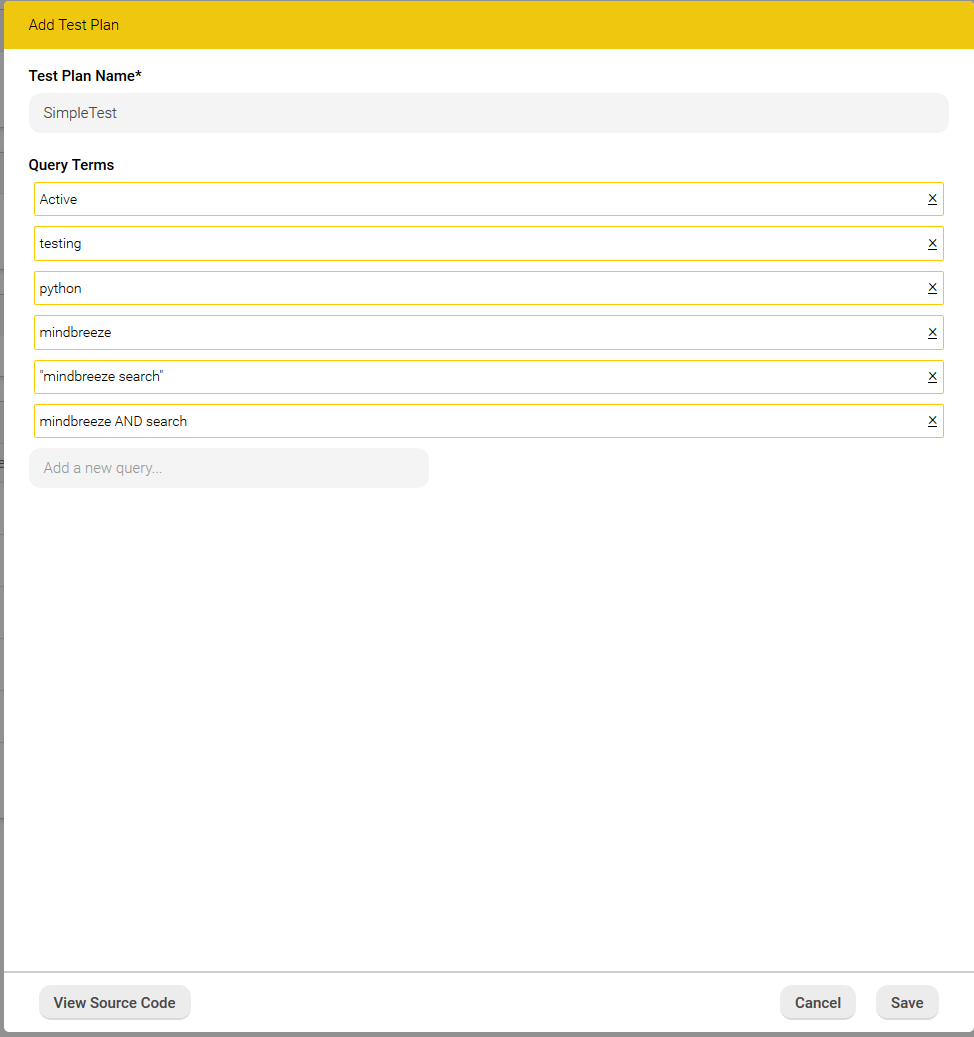
In the “Test Plan” of the management interface click on “Add Test Plan”. On the dialog you can specify a name for the test plan to be added and you can add some query terms that should be tested.
If more advanced features are needed, like key and property expectations, the test plan source can be manually edited and refined using the “View Source Code” button.
After the test plan is complete, it should be saved and then will be available for a test job launch.
Starting a Test
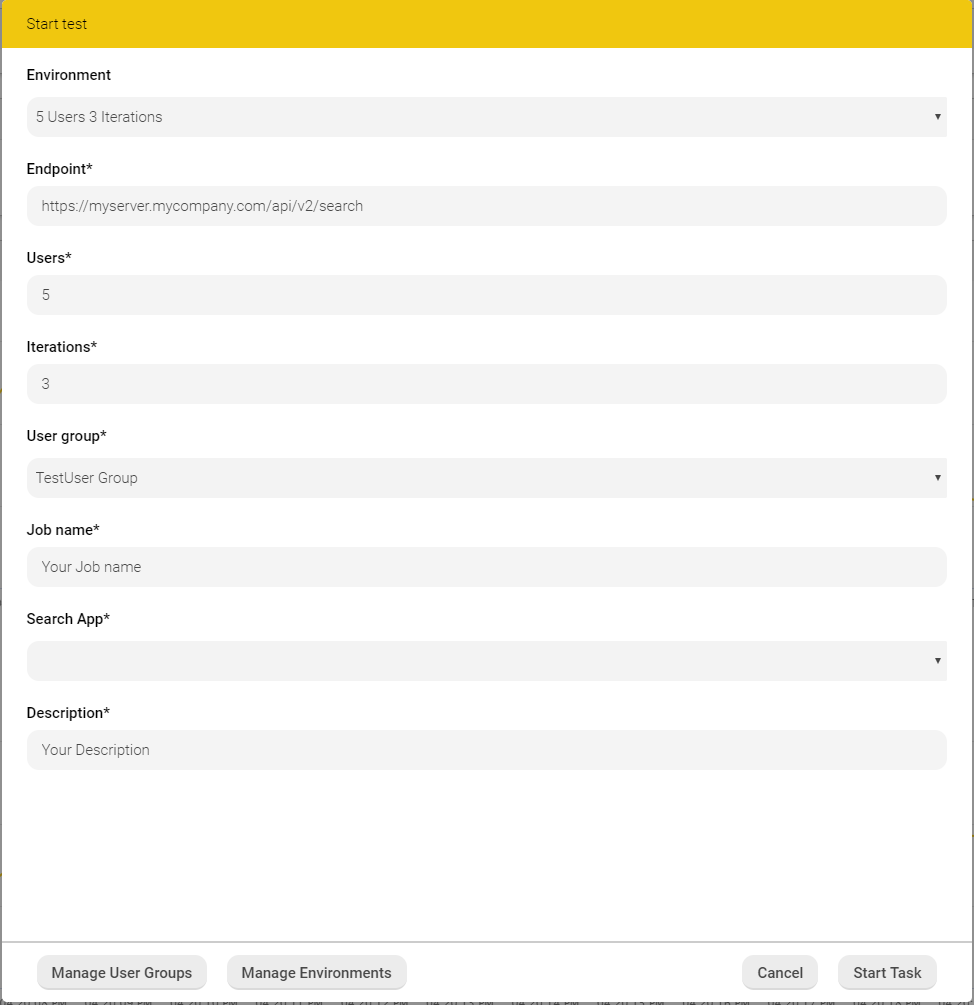
After a test plan is created you can start a test job by clicking on the “Start Test” button next to the created test plan in the “Test Plans” list.
For starting a test job, the following parameters are required:
Setting | Description |
Endpoint | The URL of the Mindbreeze Client Service search API endpoint. |
Users | Count of parallel searches. |
Iterations | Count of iterations over the given test plan. |
User group | The list of users associated to the searches, if not available, this can be configured with “Manage User Groups”. |
Job name | The name of the job. |
Search App | Selected search app for performing the test. |
Description | A text description of the current test job. |
Setting up a „User Group”
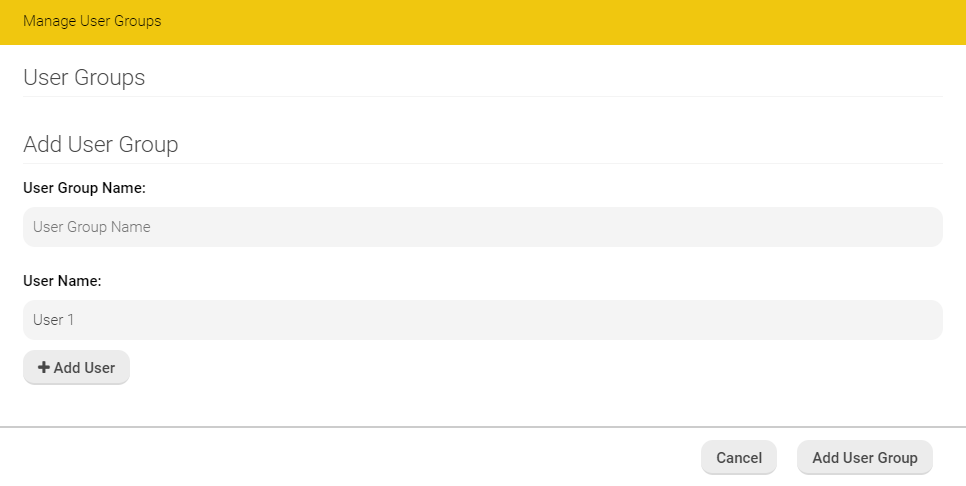
Click on “Manage User Groups” in the dialog for test starting and set a name for the user group in the “Add User Group” section.
Add users to the created group and finally click on the “Add User Group” button.
After finished, with “Cancel” you can return to the original dialog:
The created user group should be available for selection in the “User group” dropdown list.
If a user group is selected for a test job run, the requests are sent with HTTP header “X-Username” set to the user names included in the user group. For the Client Service to recognize this header, the Request Header Session Authentication must be configured.
If the count of the users set for the test run exceeds the user group size, the remaining user names are set again with the first users of the user group.
Add Environments
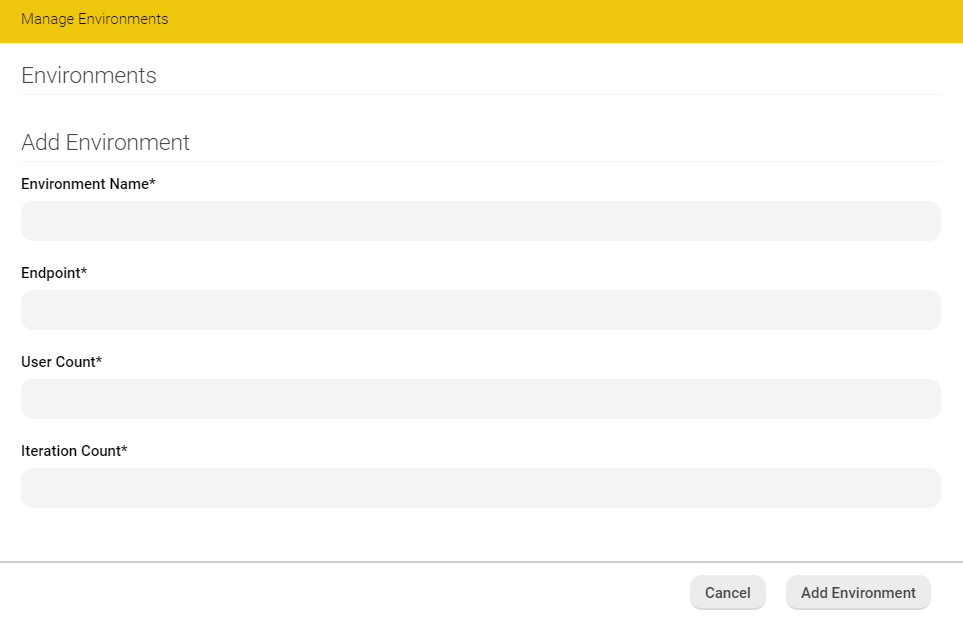
Using the “Manage Environments” dialog you can create and save predefined test environments. Environments can be used to define some base settings. These base settings can be applied when starting a test by selecting the defined “Environment” in the “Start test” dialog (see section “Starting a Test”).
The following parameters are required:
Setting | Description |
Environment Name | Name of the environment. |
Endpoint | Mindbreeze Client Service search API endpoint, for example https://myserver.myorganization.com/api/v2/search. |
User Count | Number of parallel search threads. |
Iteration Count | Number of test iterations: how many times the action list set defined. |
Monitoring a Test Run
Start the test run as described in the previous section. Real time monitoring of the current test is available in “Execution (Jobs)”:
Here a real time graph showing the number of queries executed per second and the average request duration. Different colors of the graph mark different iterations.
Test Reports
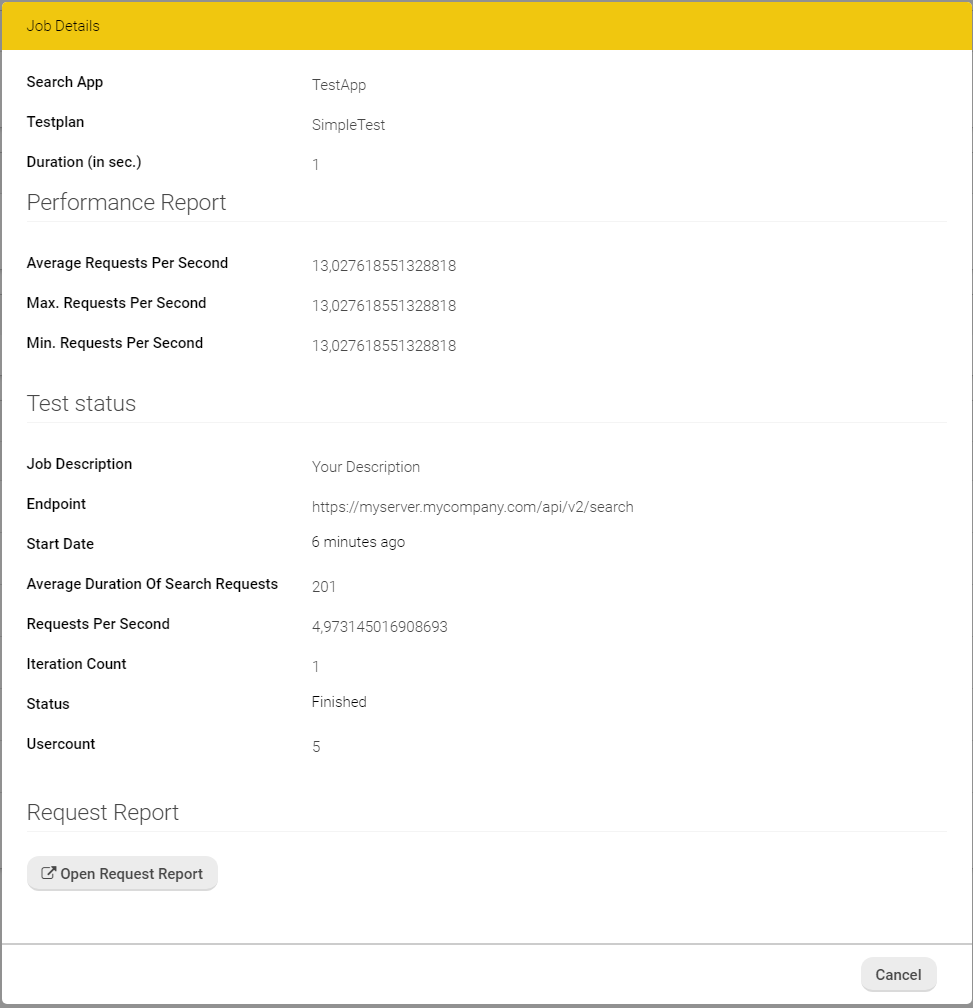
After the job finished, it is listed in the Job History. By clicking on “Details” a report of the executed job is shown.
On the first page a general report and, if it is the case, a list of errors that occurred during the test job execution is shown.
The following execution parameters are displayed:
Parameter | Description |
Search App | The name of the search app. |
Testplan | The name of the test plan. |
Duration | The duration of the test plan execution (job) in seconds. |
Average Requets Per Second | The average number of executed requests per second during the job. |
Max. Requests Per Second | The maximum number of executed requests per second during the job. |
Min. Requests Per Second | The minimum number of executed requests per second during the job. |
Job Description | The job description. |
Endpoint | The URL of the Mindbreeze Client Service search API endpoint. |
Start Date | The date when the job started. |
Average Duration of Search Requests | The average duration of a search request in milliseconds during the job. |
Requests Per Second | The average requests per second during the job. |
Iteration Count | The number of search iterations. |
Status | The status of the jobs (running, finished, canceled, queuing). |
Usercount | The number of concurrently searching users. |
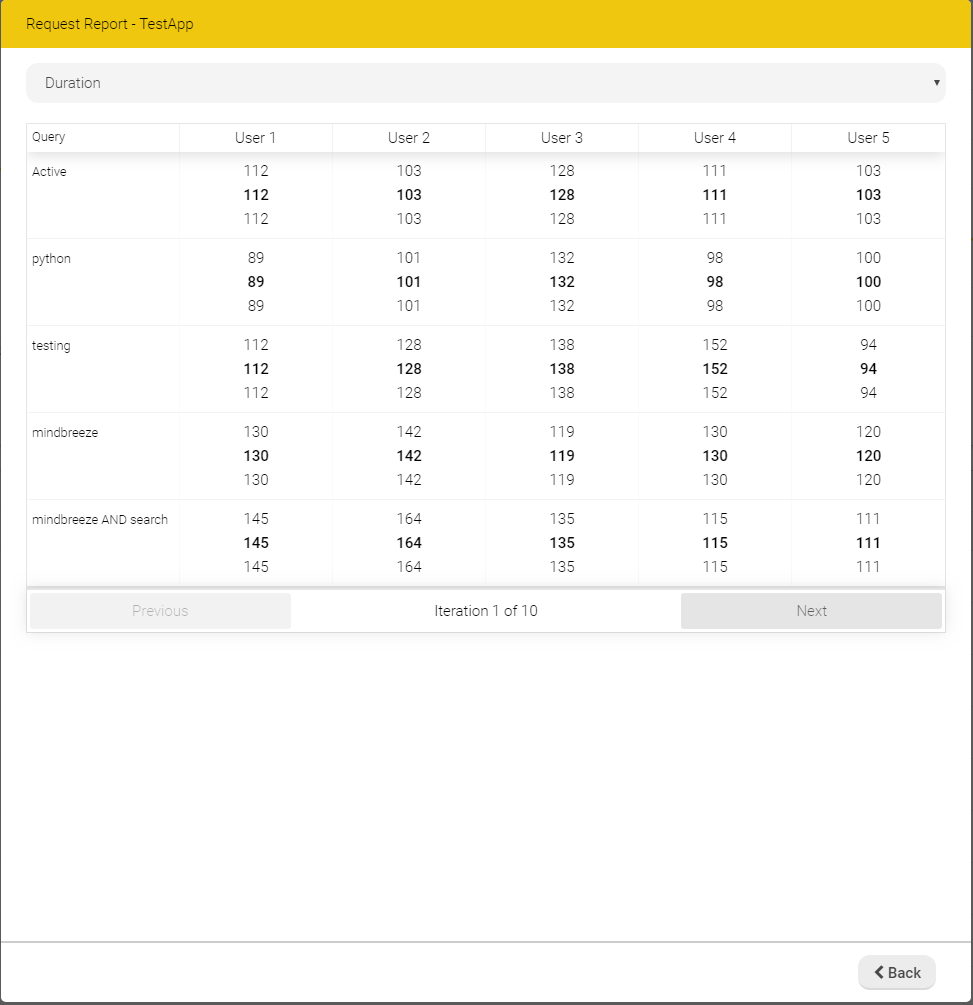
Using the “Request Report” view a detailed report of each executed query is shown. The data shown in the table is the minimum, the average and the maximum value of the request parameter chosen. Using the paging controls, one can navigate through all test iterations and show the data.
The following request parameters can be shown:
Parameter | Description |
Duration | Duration of request in milliseconds. |
Count | Count of delivered results for the given query. |
Estimated Count | Estimated count of available results for the given query. |
Answer Count | Count of delivered NLQA answers for the given query. |
Example of a Test Plan Execution (Job)
The following example describes the procedure how a job is executed with the following settings:
Settings
- Testplan (Query Terms):
- Active
- testing
- python
- mindbreeze
- “mindbreeze search”
- mindbreeze AND search
- Users: 5
- Iterations: 3
- User Group
- User 1
- User 2
- User 3
Execution
Since 5 users are configured, 5 users will search concurrently. Because only 3 different users are configured in the “User Group”, the 5 search users will be:
- User 1
- User 2
- User 3
- User 1
- User 2
These users will start searching simultaneously, starting with the first configured query term and continuing with the other search terms (“Active”, “testing”, …, “mindbreeze AND search”). When all users completed the searches, the first iteration is finished.
Because 3 iterations are configured, this process will be repeated two more times.
During this process, the test run can be monitored (see section “Monitoring a Test Run”). When all iterations have been completed, the report can be viewed (see section “Test Reports”).


