
Sure, you can handle it. But should you?
Let our experts manage the tech maintenance while you focus on your business.
Let our experts manage the tech maintenance while you focus on your business.
Operations
app.telemetry Statistics Regarding Search Queries Ad-hoc reports and statistics dashboard charts
Ad-hoc reports
With app.telemetry, you can create ad-hoc reports about the use of Mindbreeze in the context of search queries any time you want. For example, you can quickly get an overview of frequently searched queries (or alternatively, just queries without hits).
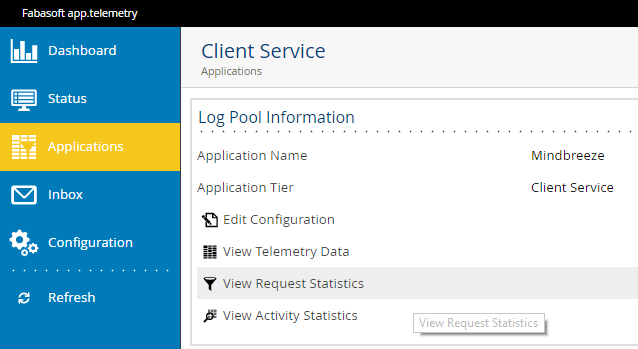
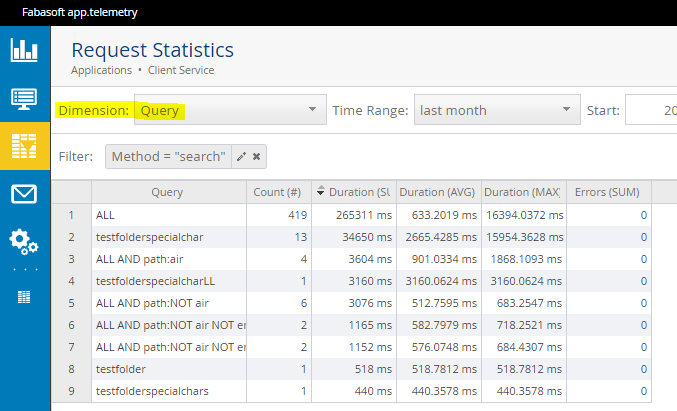
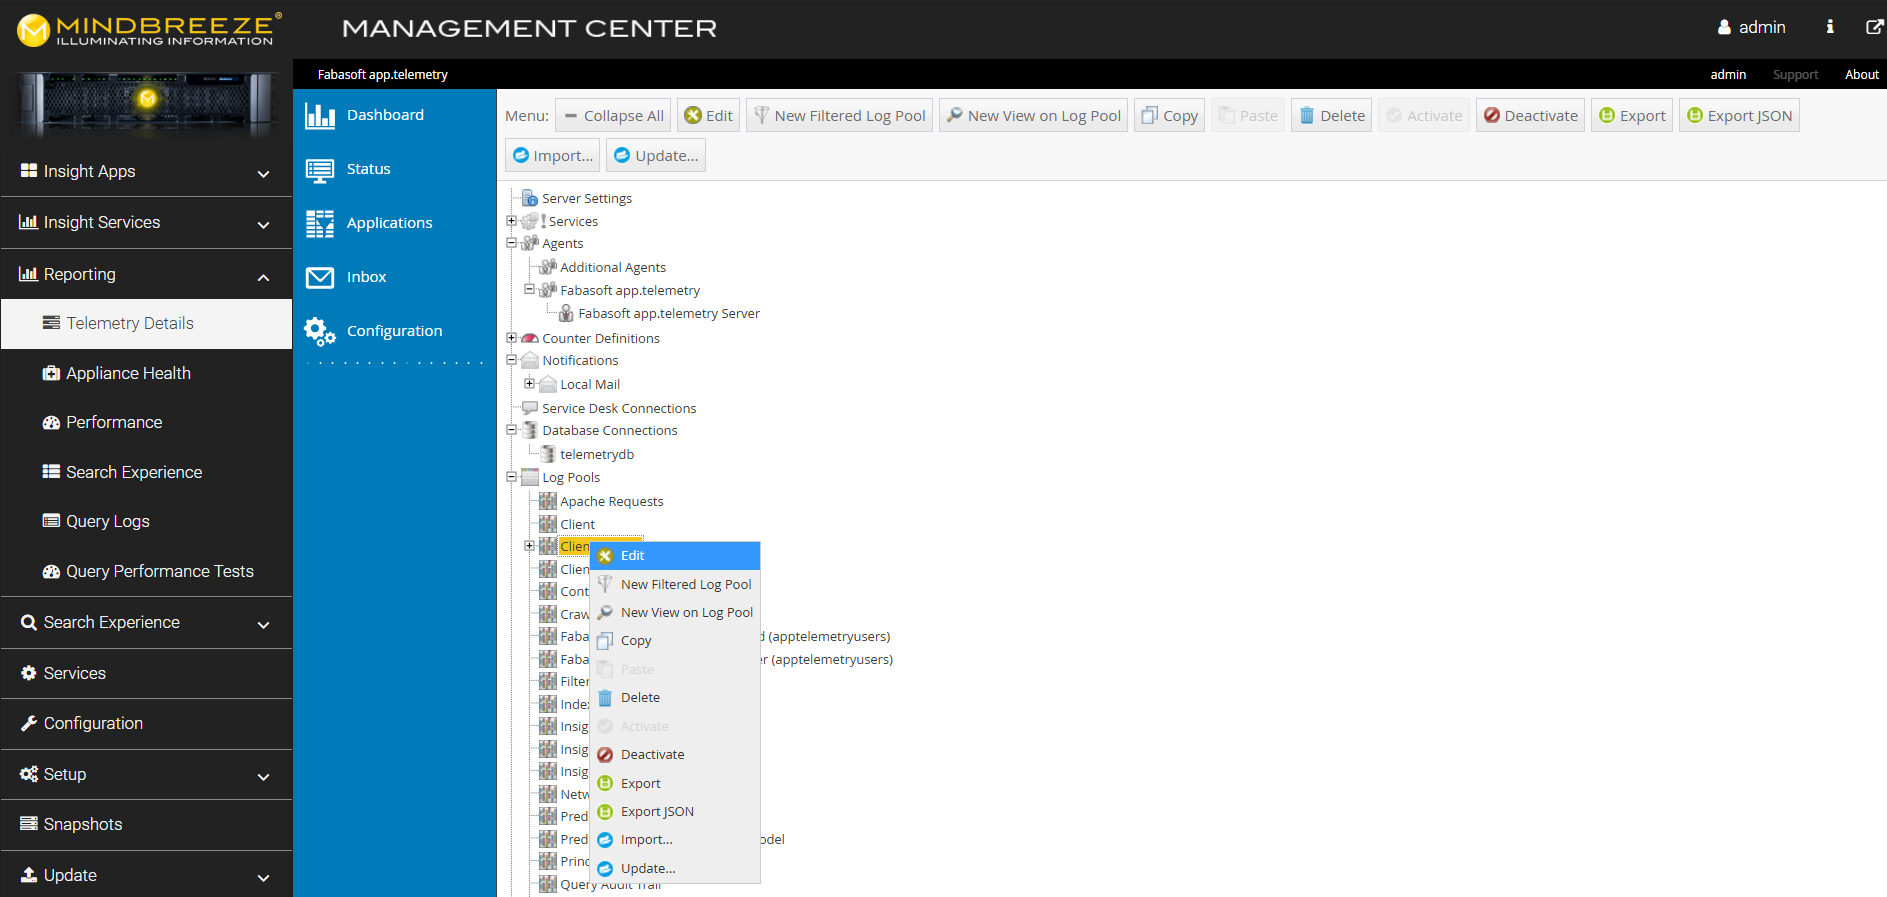
- Open the "Client Service" log pool in the "Applications" view:
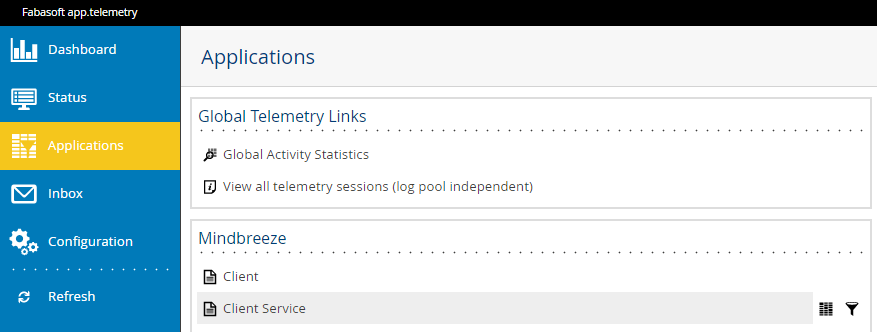
- For ad-hoc reports, open the "View Request Statistics" view of the log pool:
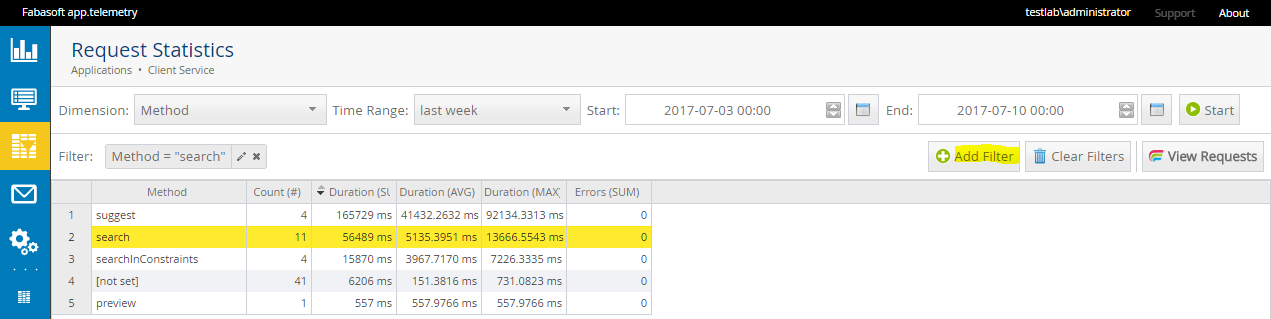
In the report view, you can now carry out analyses according to any dimensions for the selected time period and, if necessary, refine them with restrictions to specific dimension values.
- If, for instance, you’d like to limit the report to include only the user search queries (without Suggest, Preview, etc.), start the analysis using the dimension "Method" ...
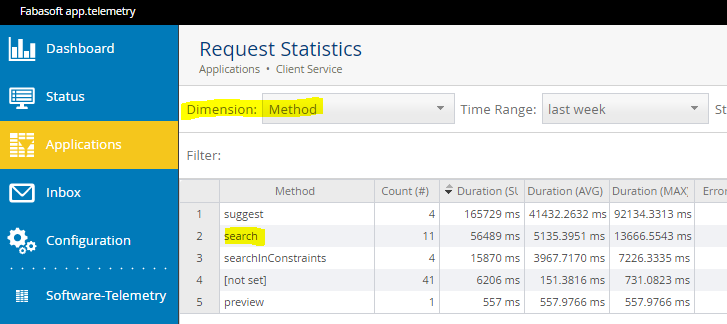
- ... and then use “Add Filter” to restrict to “search“ requests.
Frequent search queries from the previous month
Now, by switching to the dimension "Query" and entering the desired time range, you can pull up a list of the most common search queries.
Searches without hits
To pull up only the searches that didn’t result in hits, select the dimension "No Results" and then restrict to the value "TRUE" using "Add Filter".
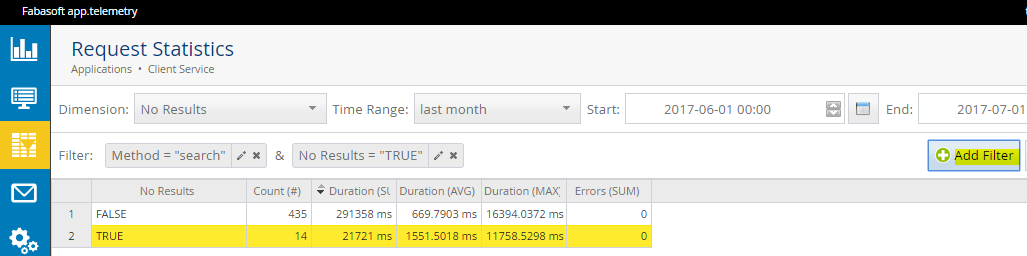
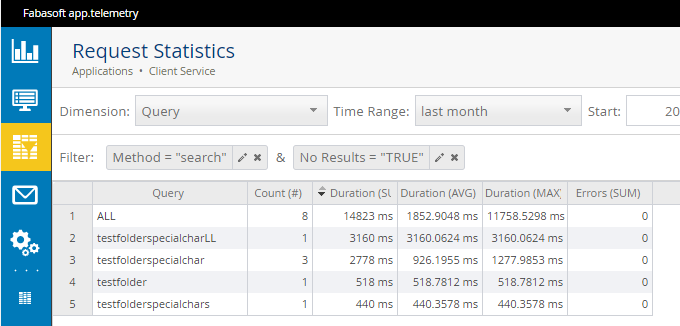
If you switch back to the dimension "Query" and define the desired time range, you’ll receive a list of all searches without hits for this period.
Identification of licensed Insight Services API calls
To see which licensed APIs are being used, select in the “Applications” view in the section “Mindbreeze Insight Services” the item “Insight Services Requests”.

In the next window, select “View Request Statistics”
Now select the dimension “Licensed API” and the desired time period under “Time Range.” Then press “Start” and select the row with “InsightServices.”

Click “Add Filter” to define the selected API as a filter. The filter will appear in the filter area.
Then change the dimension to “Usage Status” and click “Start.” Next, select the ‘LICENSED’ row and add it as a filter using “Add Filter.”
To retrieve the licensed APIs that were used, switch the dimension to “API Path.” Then press “Start” to obtain the table you are looking for.
You can now clearly see which licensed APIs have been used.
Statistics dashboard charts
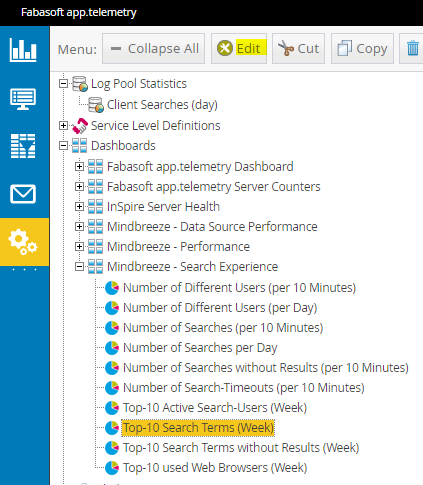
By default, Mindbreeze already provides a predefined “Mindbreeze – Search Experience“ dashboard for statistics about search usage.
If the number of search queries in an installation is too high and the loading time of this dashboard chart is no longer acceptable (or even results in a timeout), the following two strategies can be used to counter this and to take advantage of the other possibilities of the analysis.
Optimizing the default settings for a large number of search queries
The default setting of these charts can either be edited using the Edit icon in the upper right corner of each chart, or you can use the “Configuration” view to find the configuration objects.
There you can shorten the loading times and also better utilize the background cache using the following two settings:
Increase the update interval of the chart to e.g. one hour:
Decrease the analysis period of 1000 intervals (10 min each − corresponds to approximately one week) to e.g. 300 intervals (10 min each − corresponds to about 2 days).
Or you can configure aggregations on a daily basis to precalculate the values at night - see next chapter.
Log pool statistics for data aggregation
For longer-term search query analyses, we recommend that you precalculate (aggregate) the data based on a suitable interval. To do this, you can define log pool statistics with the desired interval and the necessary columns. Since this procedure is very installation-specific, you need to consider which data/columns for which period of time are suitable for the aggregation. The following is an example of our best practice.
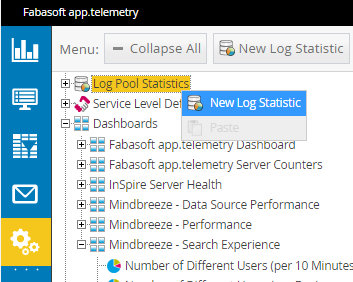
- First you create a new “Log Statistic“ object…
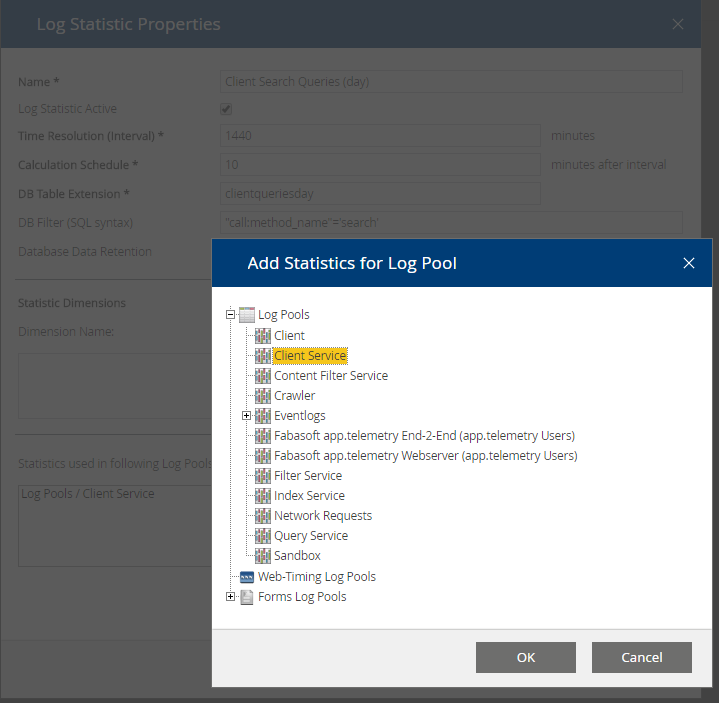
- … and then you select the desired log pool for the aggregations (e.g. Client Service).
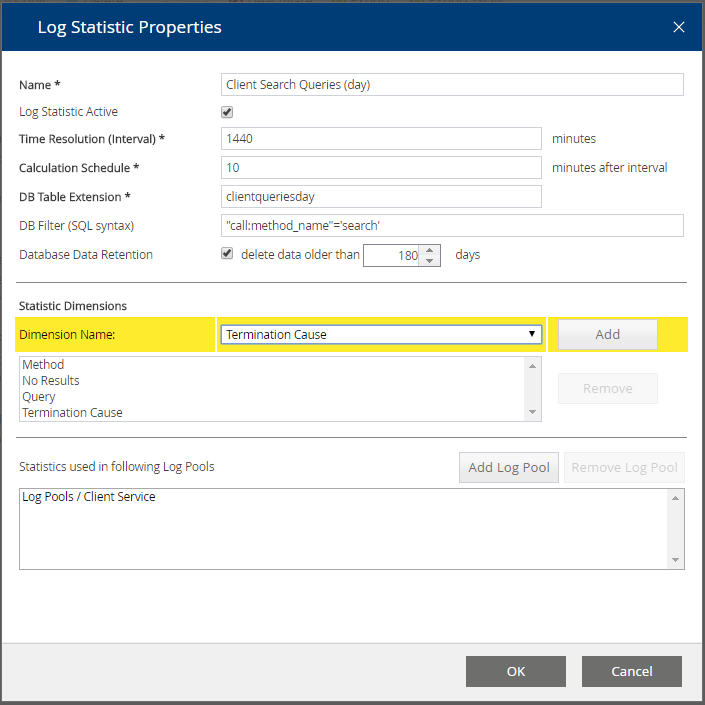
- Then, add all the dimension columns that you want to be included in the aggregation, e.g.: Method, No Results, Query, Termination Cause.
Please note: It’s important that the dimension values for the selected interval (1440 minutes = 1 day) can be well aggregated and that no random values are included. After all, the point of the aggregation is to greatly reduce the row number of the individual requests on one day.
The DB Table Extension defines a suffix for unique detection in the database. The Database Data Retention settings are used to define the time period for storing the data.
Optionally, a restriction can be defined via the DB filter using SQL conditions (in our case, for example, restricting to search requests for the method “search “... "call:method_name"='search').
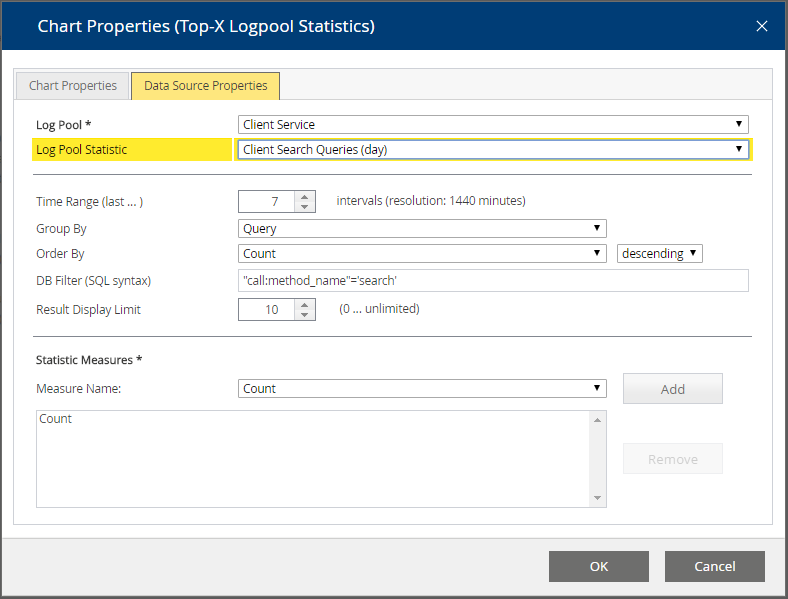
- Ultimately, you only need to activate the new statistic for the desired dashboard, i.e. instead of selecting the "<Default Statistic>" you select the newly defined one and then change the period to the newly defined (daily) interval (instead of 1000 x 10 min, it‘s 7 x 1440 min).
Note: The new statistics contain only the columns defined there and, in contrast to the default statistics, do not offer all columns.
General note about dashboard charts based on log pool statistics: The statistics are calculated once a day shortly after midnight. That means that the charts will display usable data only after a few days.
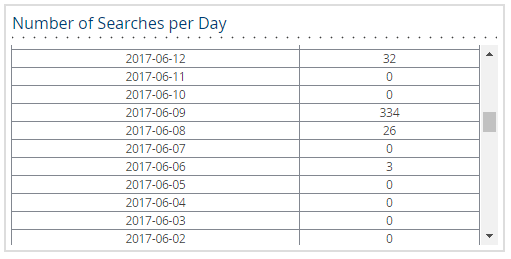
Example 2 –Searches per day
The statistics defined in the previous chapter can also be used to define a dashboard chart with the searches per day.
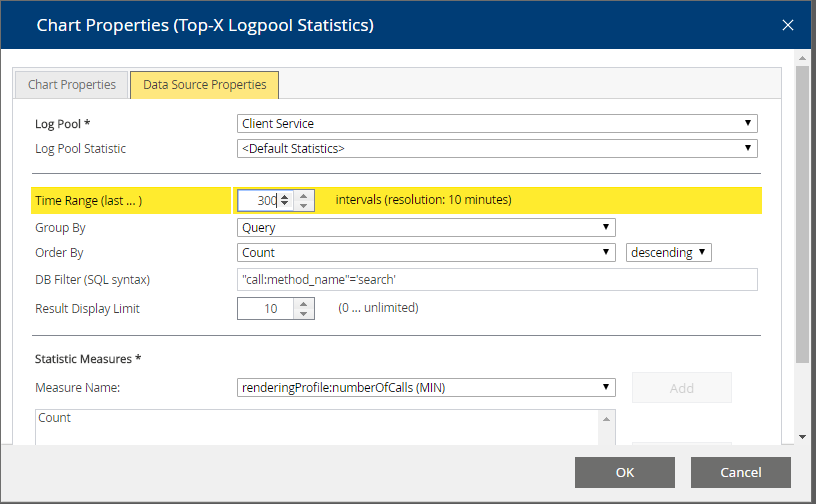
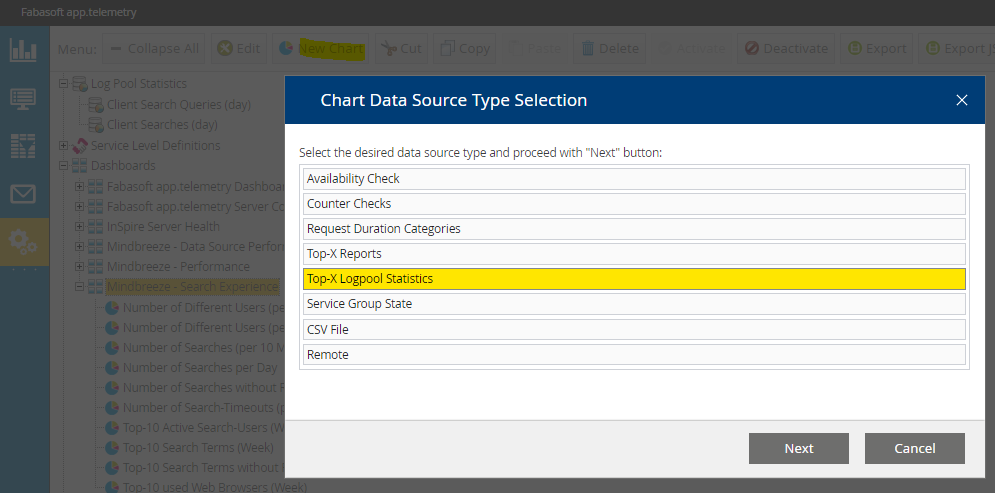
- To do this, you create a new “Top-X Logpool Statistics“ chart.
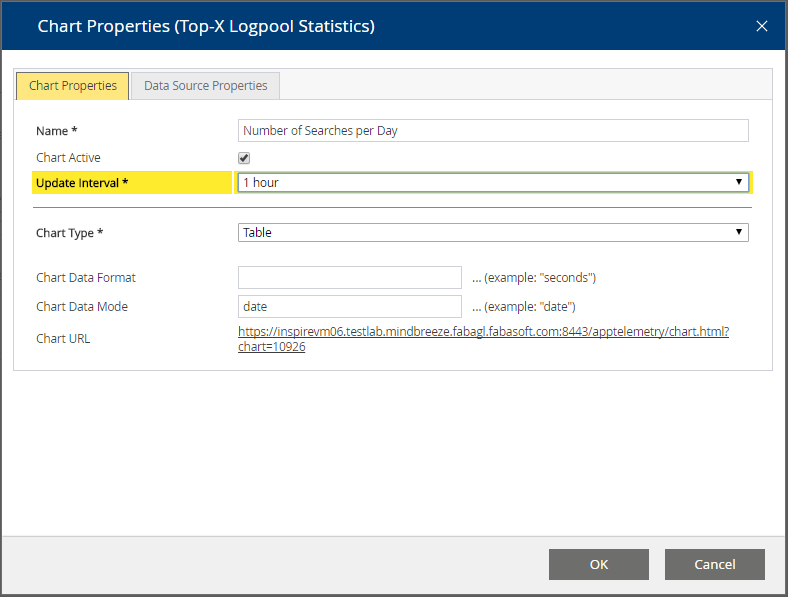
- Configure an adequate update interval and define the Table chart with the chart data mode “date“.
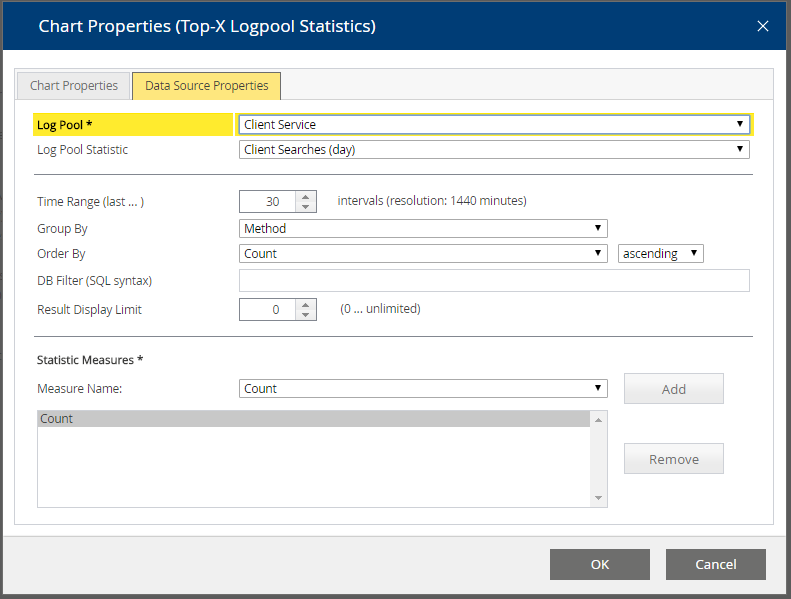
- For the "Data Source Properties", select the "Client Service" log pool as well as the previously defined daily statistics. Now you can define the number of intervals/days for the time range and group them according to the "Method" column, for instance, to pull up all the searches per day. As a measure for the display, add "Count" to the table using "Add" to get the desired number.
- The result looks something like this:

app.telemetry Troubleshooting
General information
For problems with app.telemetry the log file "/var/log/app.telemetry/apptelemetryserverd.log" is helpful.
This file is already active on G7 appliances.
Please add the following directive to the file "/etc/app.telemetry/server.conf":
ProcessOutFile /var/log/app.telemetry/apptelemetryserverd.log
The app.telemetry server service must then be restarted:
service apptelemetry server restart
Search Suggest performance issues due to the amount of rows in the logpool
Problem: The search suggest feature is working very slow or not at all. This can have many reasons. One of the reasons can be that the number of rows in the log pool is too high. To improve the performance of the Search Suggest feature, two solutions are available.
Hint: It is also possible to check, if the size of the tables is causing the search suggest performance issues. In the Management Center, open the menu item “Reporting” and click on “Telemetry Details”. Then, click on “Configuration” and expand “Database Connectors” in the structure tree. Do a right click on “telemetrydb” and choose the option “View Database Tables”.
In the new window you now have an overview of all database tables and can check for example the size of each table or the current status. See if the search suggest performance issue is caused by the size of one or more database tables.
Solution 1: Adjusting Data Retention
The performance of the Search Suggest feature can be improved by adjusting the setting „Database Data Retention“ to a shorter time span.
In the Management Center, go to “Reporting” and “Telemetry Details” and open the menu “Configuration”. In the structure tree, right click “Client Service” and choose the option “Edit”.

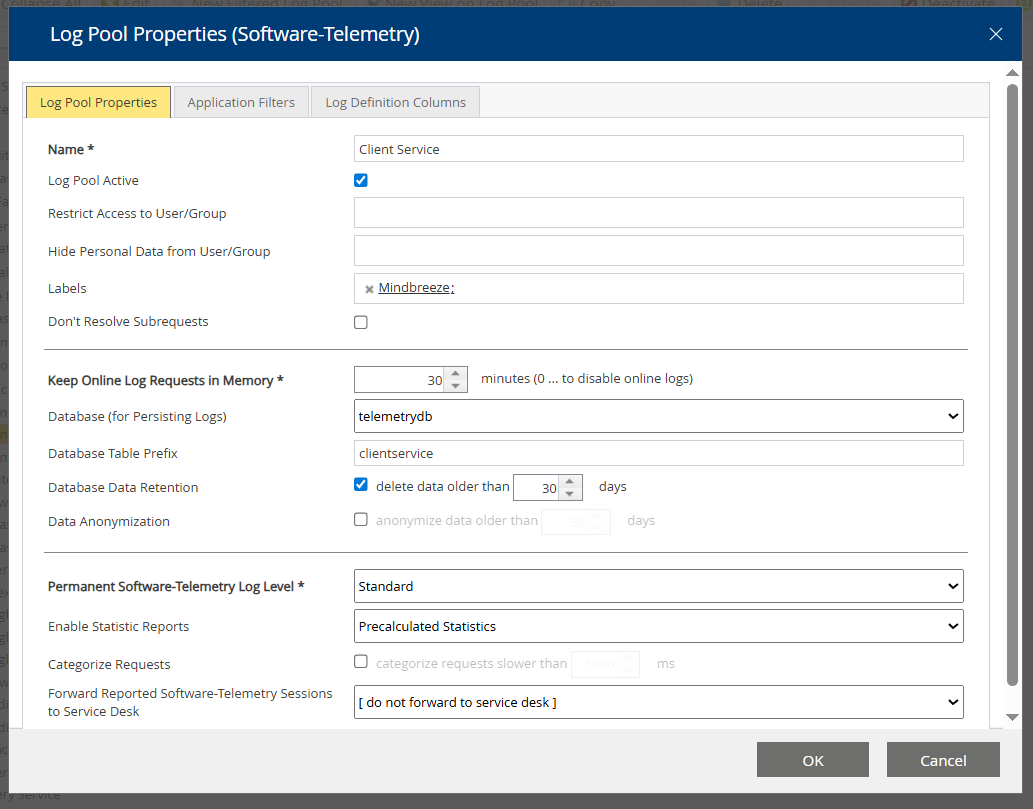
In the new window, you will find the setting “Database Data Retention” and can now change the setting to a shorter time span.
Click “OK” to save the changes. Now the performance of the search suggest feature should be improved.
Solution 2: Configuration of a Log Pool Statistic and Popular Searches
If the adjustement of the setting „Database Data Retention“ is not an option or did not improve the performance enough, the database table can be reduced to the necessary requests by configuring a Log Pool Statistic in app.telemetry and Popular Searches in the Client Service. The necessary steps are described in the following chapters.
Step 1: Configuration of the Log Pool Statistic
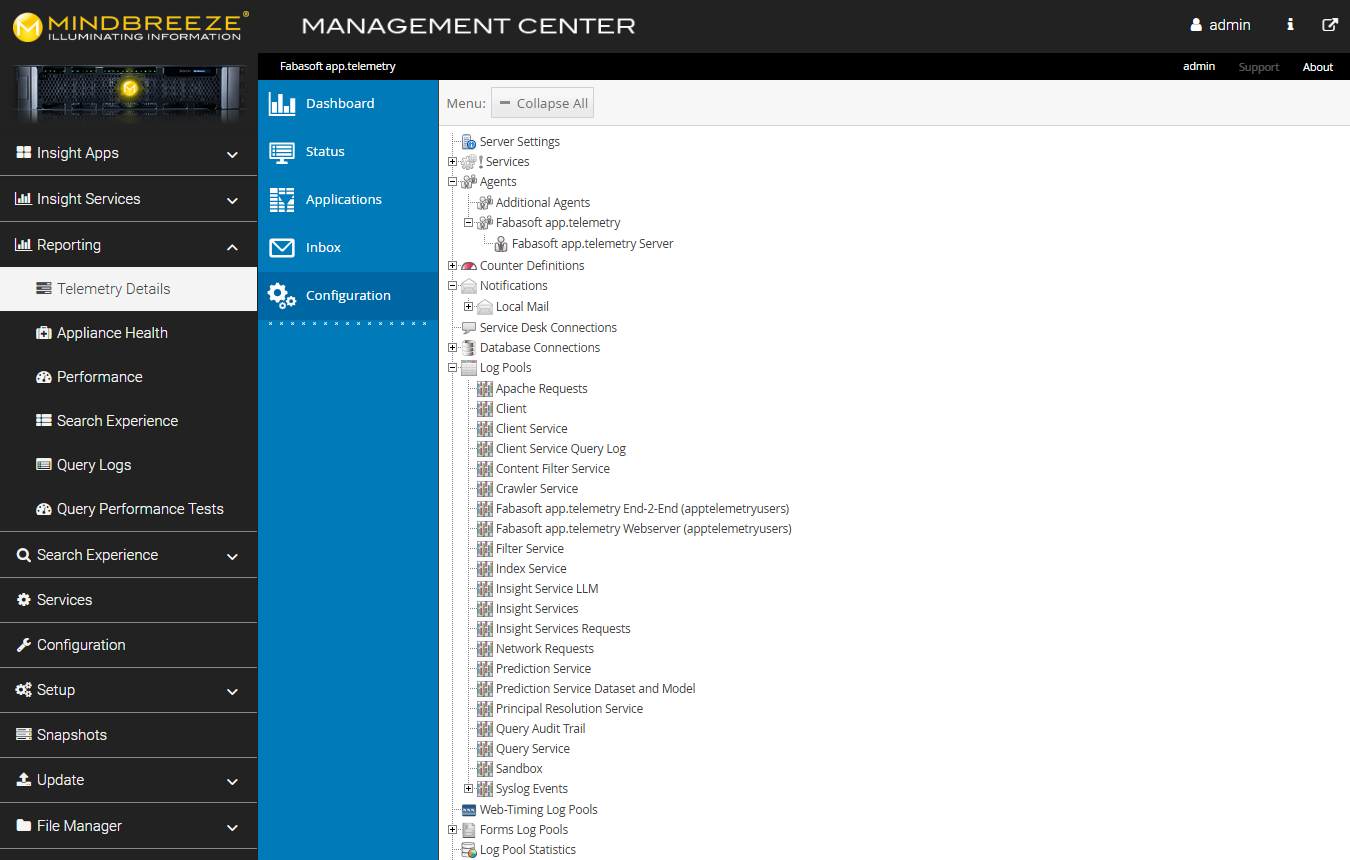
In the Management Center, go to “Reporting” and open the submenu “Telemetry Details”. Click on “Configuration” to see the structure tree.
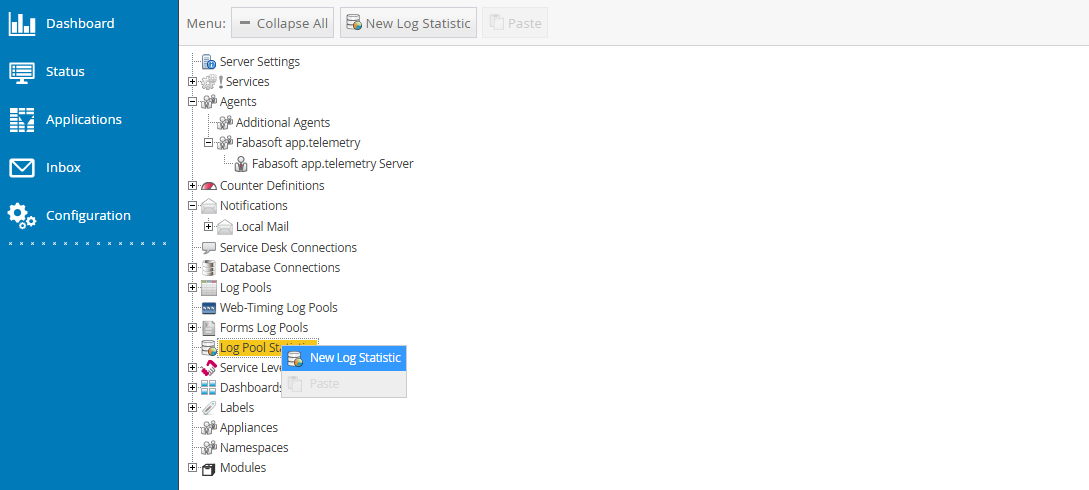
To create the necessary Log Pool Statistic, go to “Log Pool Statistics” and create a “New Log Statistic” or use an existing one.

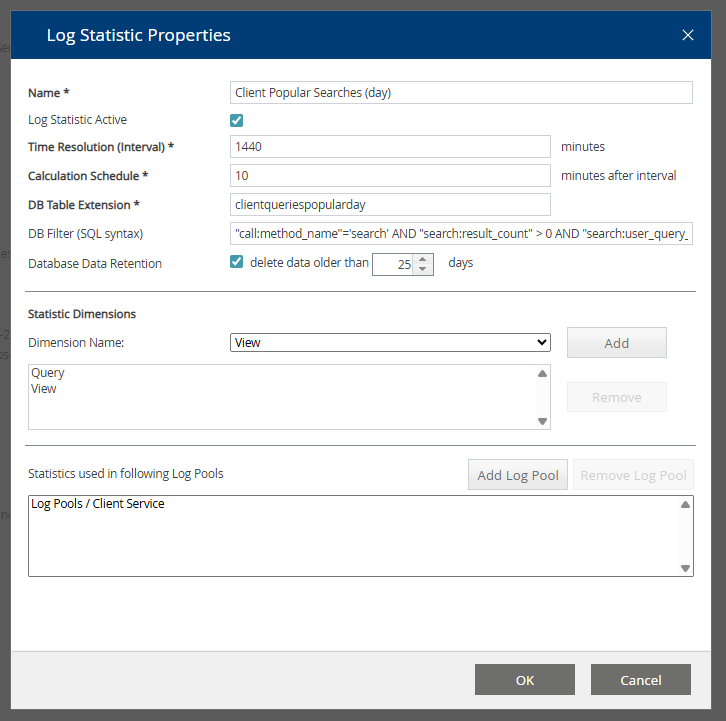
Configure the Log Pool Statistic as follows:

Setting | Entry |
Name | Example: Client Popular Searches (day) |
Log Statistics Active | Activated |
Time Resolution (Interval) | Recommended interval: 1440 minutes (= 24 hours) |
Calculation Schedule | 10 |
DB Table Extension | clientqueriespopularday |
DB Filter (SQL syntax) (Optional) | For additional improvements, it is also possible to define a filter to exclude for example empty searches or searches where the search suggest feature is not needed, for example a search with a star (*): "call:method_name"='search' AND "search:result_count" > 0 AND "search:user_query_expr"<>'' AND "search:user_query_expr"<>'ALL' AND "search:user_query_expr"<>'*' AND "search:user_query_expr"<>' initialemptyquery' |
Database Data Retention | By default activated and set to 25 days. In order to not possibly constrain the search suggest feature, it can also be set to a longer time span, for example 90 days. |
Dimension Name | The following dimensions are necessary, so that the configuration of the Popular Searches in the next step, can work.
Hint: To select a dimension name, a log pool must be added in the following setting “Statistics used in following Log Pools” first. |
Statistics used in following Log Pools | Add the original Client Service Log Pool, to be able to select dimension names in the setting “Dimension Name”:
Hint: If a Filtered Log Pool is configured, it can be added here as well. For example:
For more information, see the chapter Optional Step: Configuration of a Filtered Log Pool. |
Click “OK” to finish the creation of the Log Pool Statistic.
Attention: Be aware, that the Log Pool Statistic is being created overnight and becomes effective the next day. Therefore, please wait until the next day to see if the Log Pool Statistic works as intended.
Step 2: Configuration of the client service
After the Log Pool Statistic has been configured, the Client Service must be adjusted to take over what the configured Log Pool Statistic is preparing.
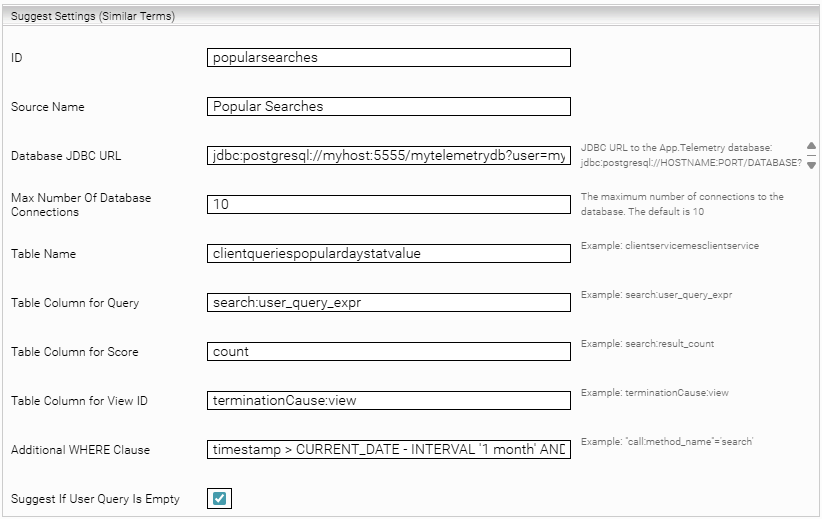
In the Management Center, in the menu item “Configuration”, go to the tab “Client Services” and activate “Advanced Settings”. Open the Client Service you are using and go to the section “Suggest Settings (Similar Terms)”. Configure the settings as follows:

Setting | Entry |
ID | popularsearches |
Source Name | Popular Searches |
Database JDBC URL | The URL has the following structure: jdbc:postgresql://HOSTNAME:PORT/DATABASE?user=USERNAME&password=PASSWOR Example: jdbc:postgresql://myhost:5555/mytelemetrydb?user=mytelemetryuser&password=MyPassword Hint: The password is the standard password as provided by Mindbreeze. You can test the connection to the database in app.telemetry in the menu item “Configuration”. In the structure tree, expand “Database Connections”, right click on “telemetrydb” and choose the option “Edit”. In the new window, click on the button “Test” to test the connection to the database. |
Max Number Of Database Connections | 10 |
Table Name | Defines the necessary database table where the results of the configured Log Pool Statistic are saved. The table name can be found in the menu item “Configuration” in the app.telemetry. In the structure tree, expand “Database Connections”, right click “telemetrydb” and choose the option “View Database Tables”. Example: clientqueriespopulardaystatvalue Attention: Please be aware that the table name can change if, for example, a Filtered Log Pool is configured at a later date. Make sure that the table name is always correct. Example:
|
Table Column for Query | search:user_query_expr |
Table Column for Score | count |
Table Column for View ID | terminationCause:view |
Additional WHERE Clause (Optional) | Alternatively, the following Where Clause can be defined to exclude suggestions that are older than a month: timestamp > CURRENT_DATE - INTERVAL '1 month' AND "search:user_query_expr" !~ '["():]|OR|NEAR|AND|ALL|initialemptyquery' Be aware that this clause only excludes suggestions that are older than a month and does not improve the performance of the search suggest feature. The clause can also be added at a later date. |
Suggest If User Query Is Empty | Activated |
Finally, save the changes to finish the configuration.
After the configuration of the Log Pool Statistic and the Popular Searches are done, the search suggest feature should work again and/or the performance should be improved.
Optional Step: Configuration of a Filtered Log Pool
The performance of the search suggest feature can be further improved with the configuration of a Filtered Log Pool. The necessary steps are described below.
In the Management Center, go to “Reporting” and open the submenu “Telemetry Details”. Click on “Configuration” to see the structure tree.
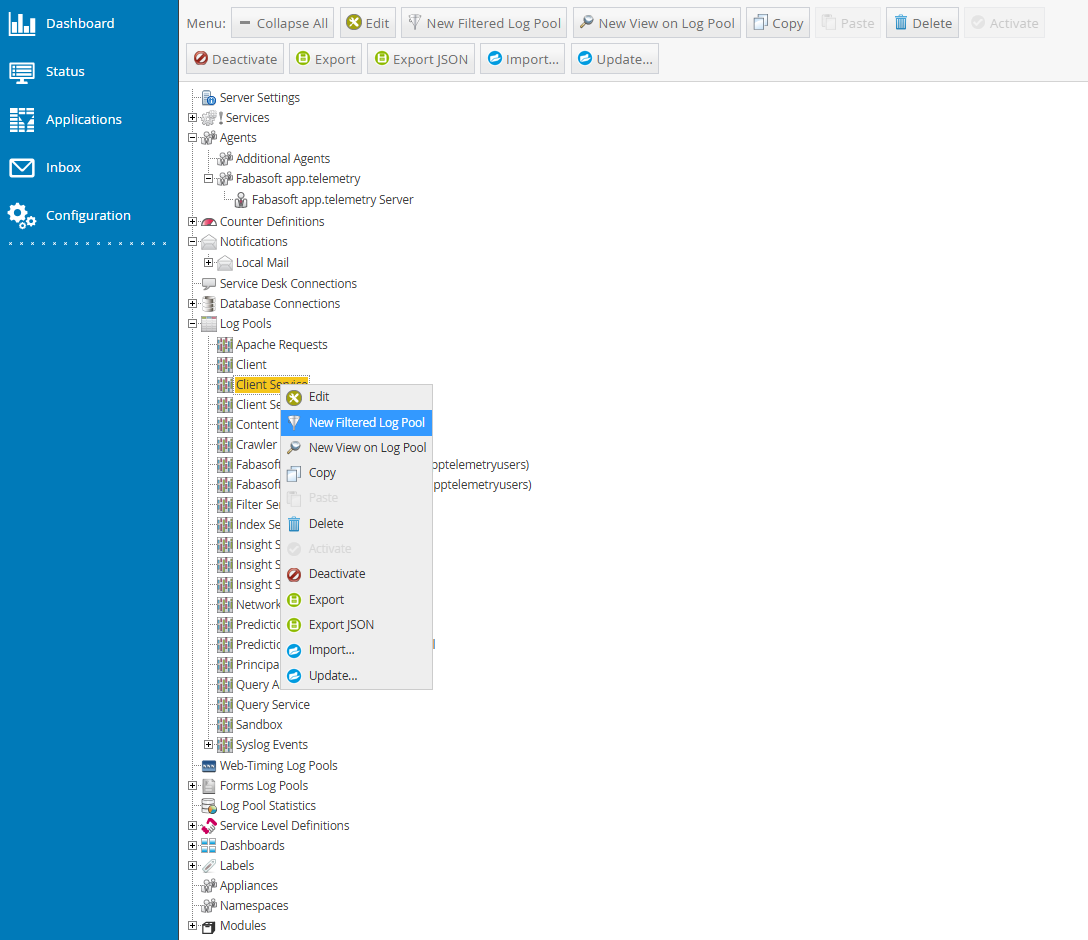
To create the filtered log pool, expand the section “Log Pools”, click on “Client Service” and create a “New Filtered Log Pool” or use an existing one.
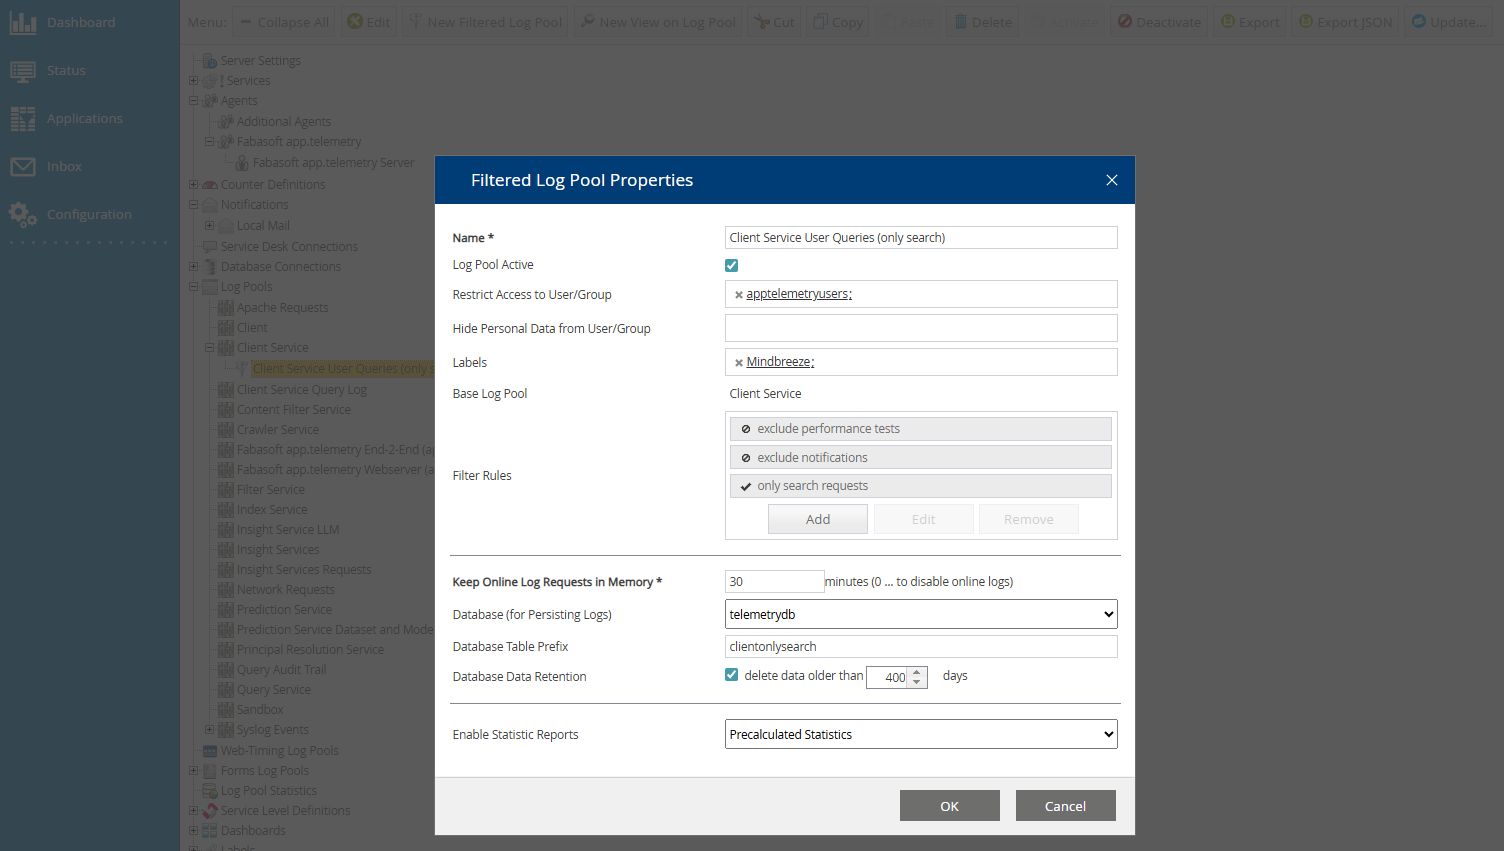
In the window “Filtered Log Pool Properties”, configure the following settings:

Setting | Entry |
Name | Example: Client Service User Queries (only search) |
Log Pool Active | Activated |
Restrict Access to User/Group | apptelemetryusers |
Labels | Mindbreeze |
Filter Rules |
Attention: Be aware that the last filter rule must have the rule type “Accept” to make sure that all filter rules are being executed. |
Database (for Persisting Logs) | telemetrydb |
Database Table Prefix | clientonlysearch |
Database Data Retention | Activated and set to 400 days. |
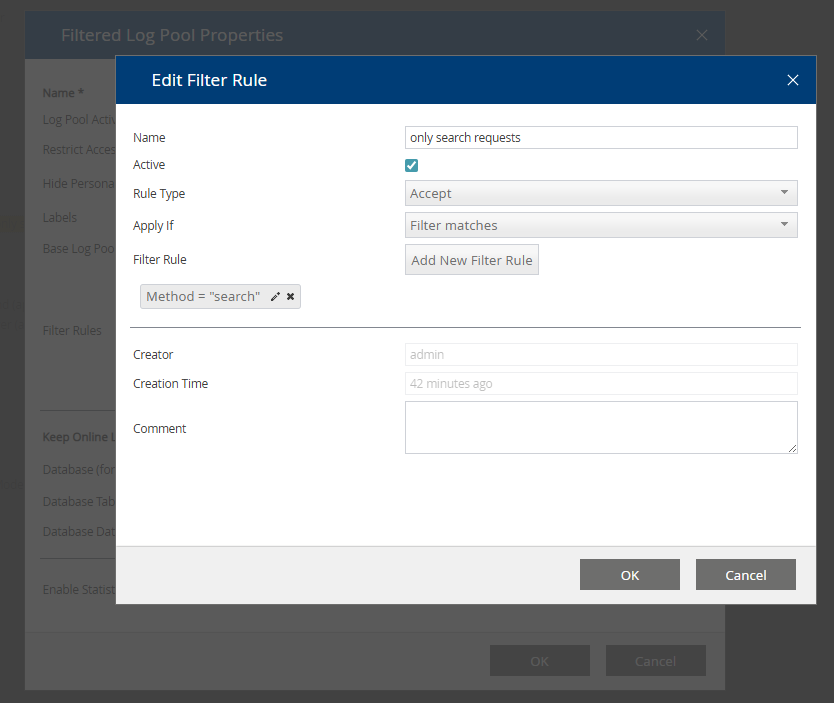
To configure the necessary filter rule “only search requests” the following settings are needed:
Setting | Entry |
Name | Example: only search requests |
Active | Activated |
Rule Type | Accept |
Filter Rule | Configure the filter rule as follows: Method = search |

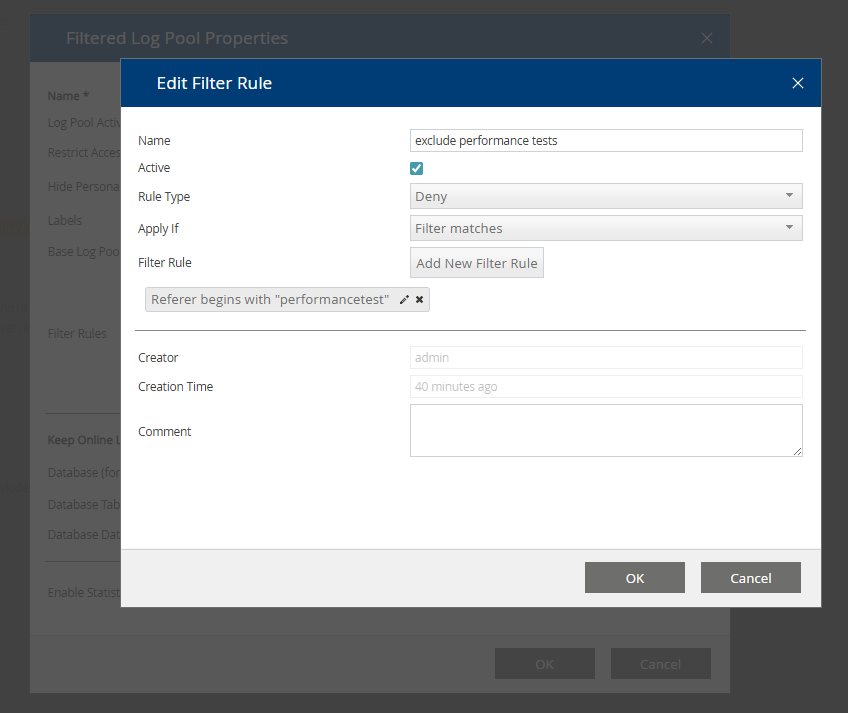
Based on the use case, it is also possible to configure additional filter rules. For example, to exclude performance tests, the optional filter rule can be configured like this:
Setting | Entry |
Name | Example: exclude performance tests |
Active | Activated |
Rule Type | Deny |
Filter Rule | Configure the filter rule as follows: Referer begins with performancetest |
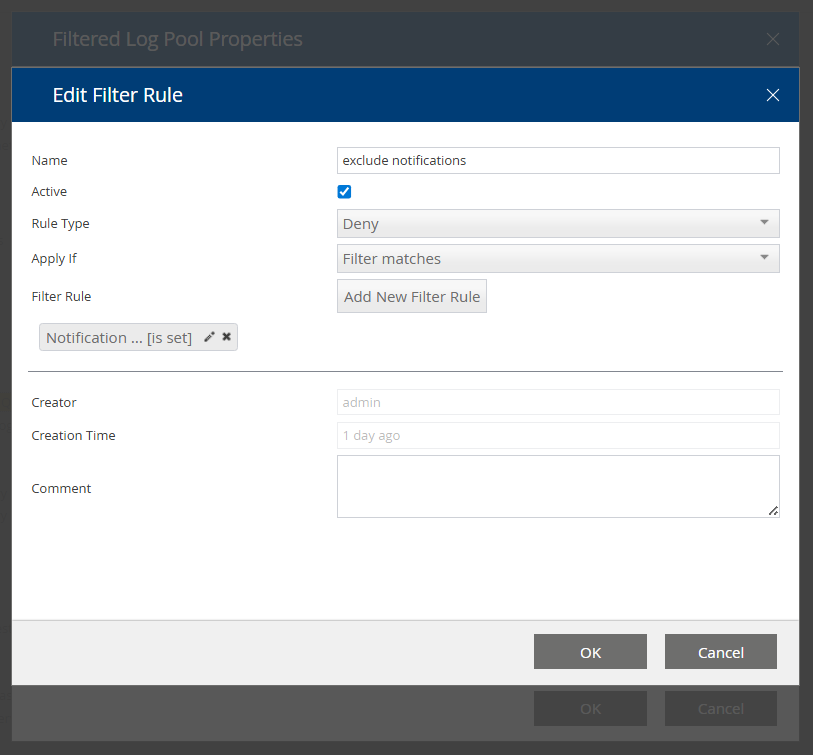
To exclude notifications, the optional filter rule can be configured like this:
Setting | Entry |
Name | Example: exclude notifications |
Active | Activated |
Rule Type | Deny |
Filter Rule | Configure the filter rule as follows: Notification is set |
Click “OK” to finish the definition of the filter rules and the configuration of the filtered log pool.
Finally, due to the configuration of the filtered log pool, the setting “Table Name” must be adjusted in the Client Service, as mentioned in the description of the setting. For more information, please see the chapter Step 2: Configuration of the client service.